Revenues Report
The Revenues report provides a consolidated and visual overview of your invoice performance, helping you understand how revenue is distributed across different invoice statuses and time periods.
This report is designed to support financial analysis, forecasting, and decision-making by presenting clear metrics and interactive charts.

General Overview
The Revenues dashboard is divided into clear visual sections:
Revenue by Invoice Status
At the top of the screen, summary cards display the total value of invoices by status:
- Open invoices – invoices issued but not yet finalised
- Paid invoices – successfully completed and paid invoices
- Cancelled invoices – invoices cancelled but retained for audit purposes
Each card shows:
- Total revenue amount
- Number of invoices
- Comparison with the previous period
Key Revenue Indicators
Below the summary cards, you will find statistical indicators for the selected period:
- Maximum revenue value
- Average invoice value
- Minimum invoice value
These metrics provide a quick snapshot of revenue distribution and variability.
Revenue Evolution
A combined bar and line chart illustrates the revenue evolution over time, allowing you to:
- Identify growth or decline trends
- Compare monthly performance
- Visualise cumulative revenue progression
Revenue Composition
A pie chart displays the composition of revenue by invoice status, making it easy to understand the proportion of:
- Open
- Paid
- Cancelled
Filtering and Data Selection
The Revenues report includes advanced filtering options to refine the displayed data.
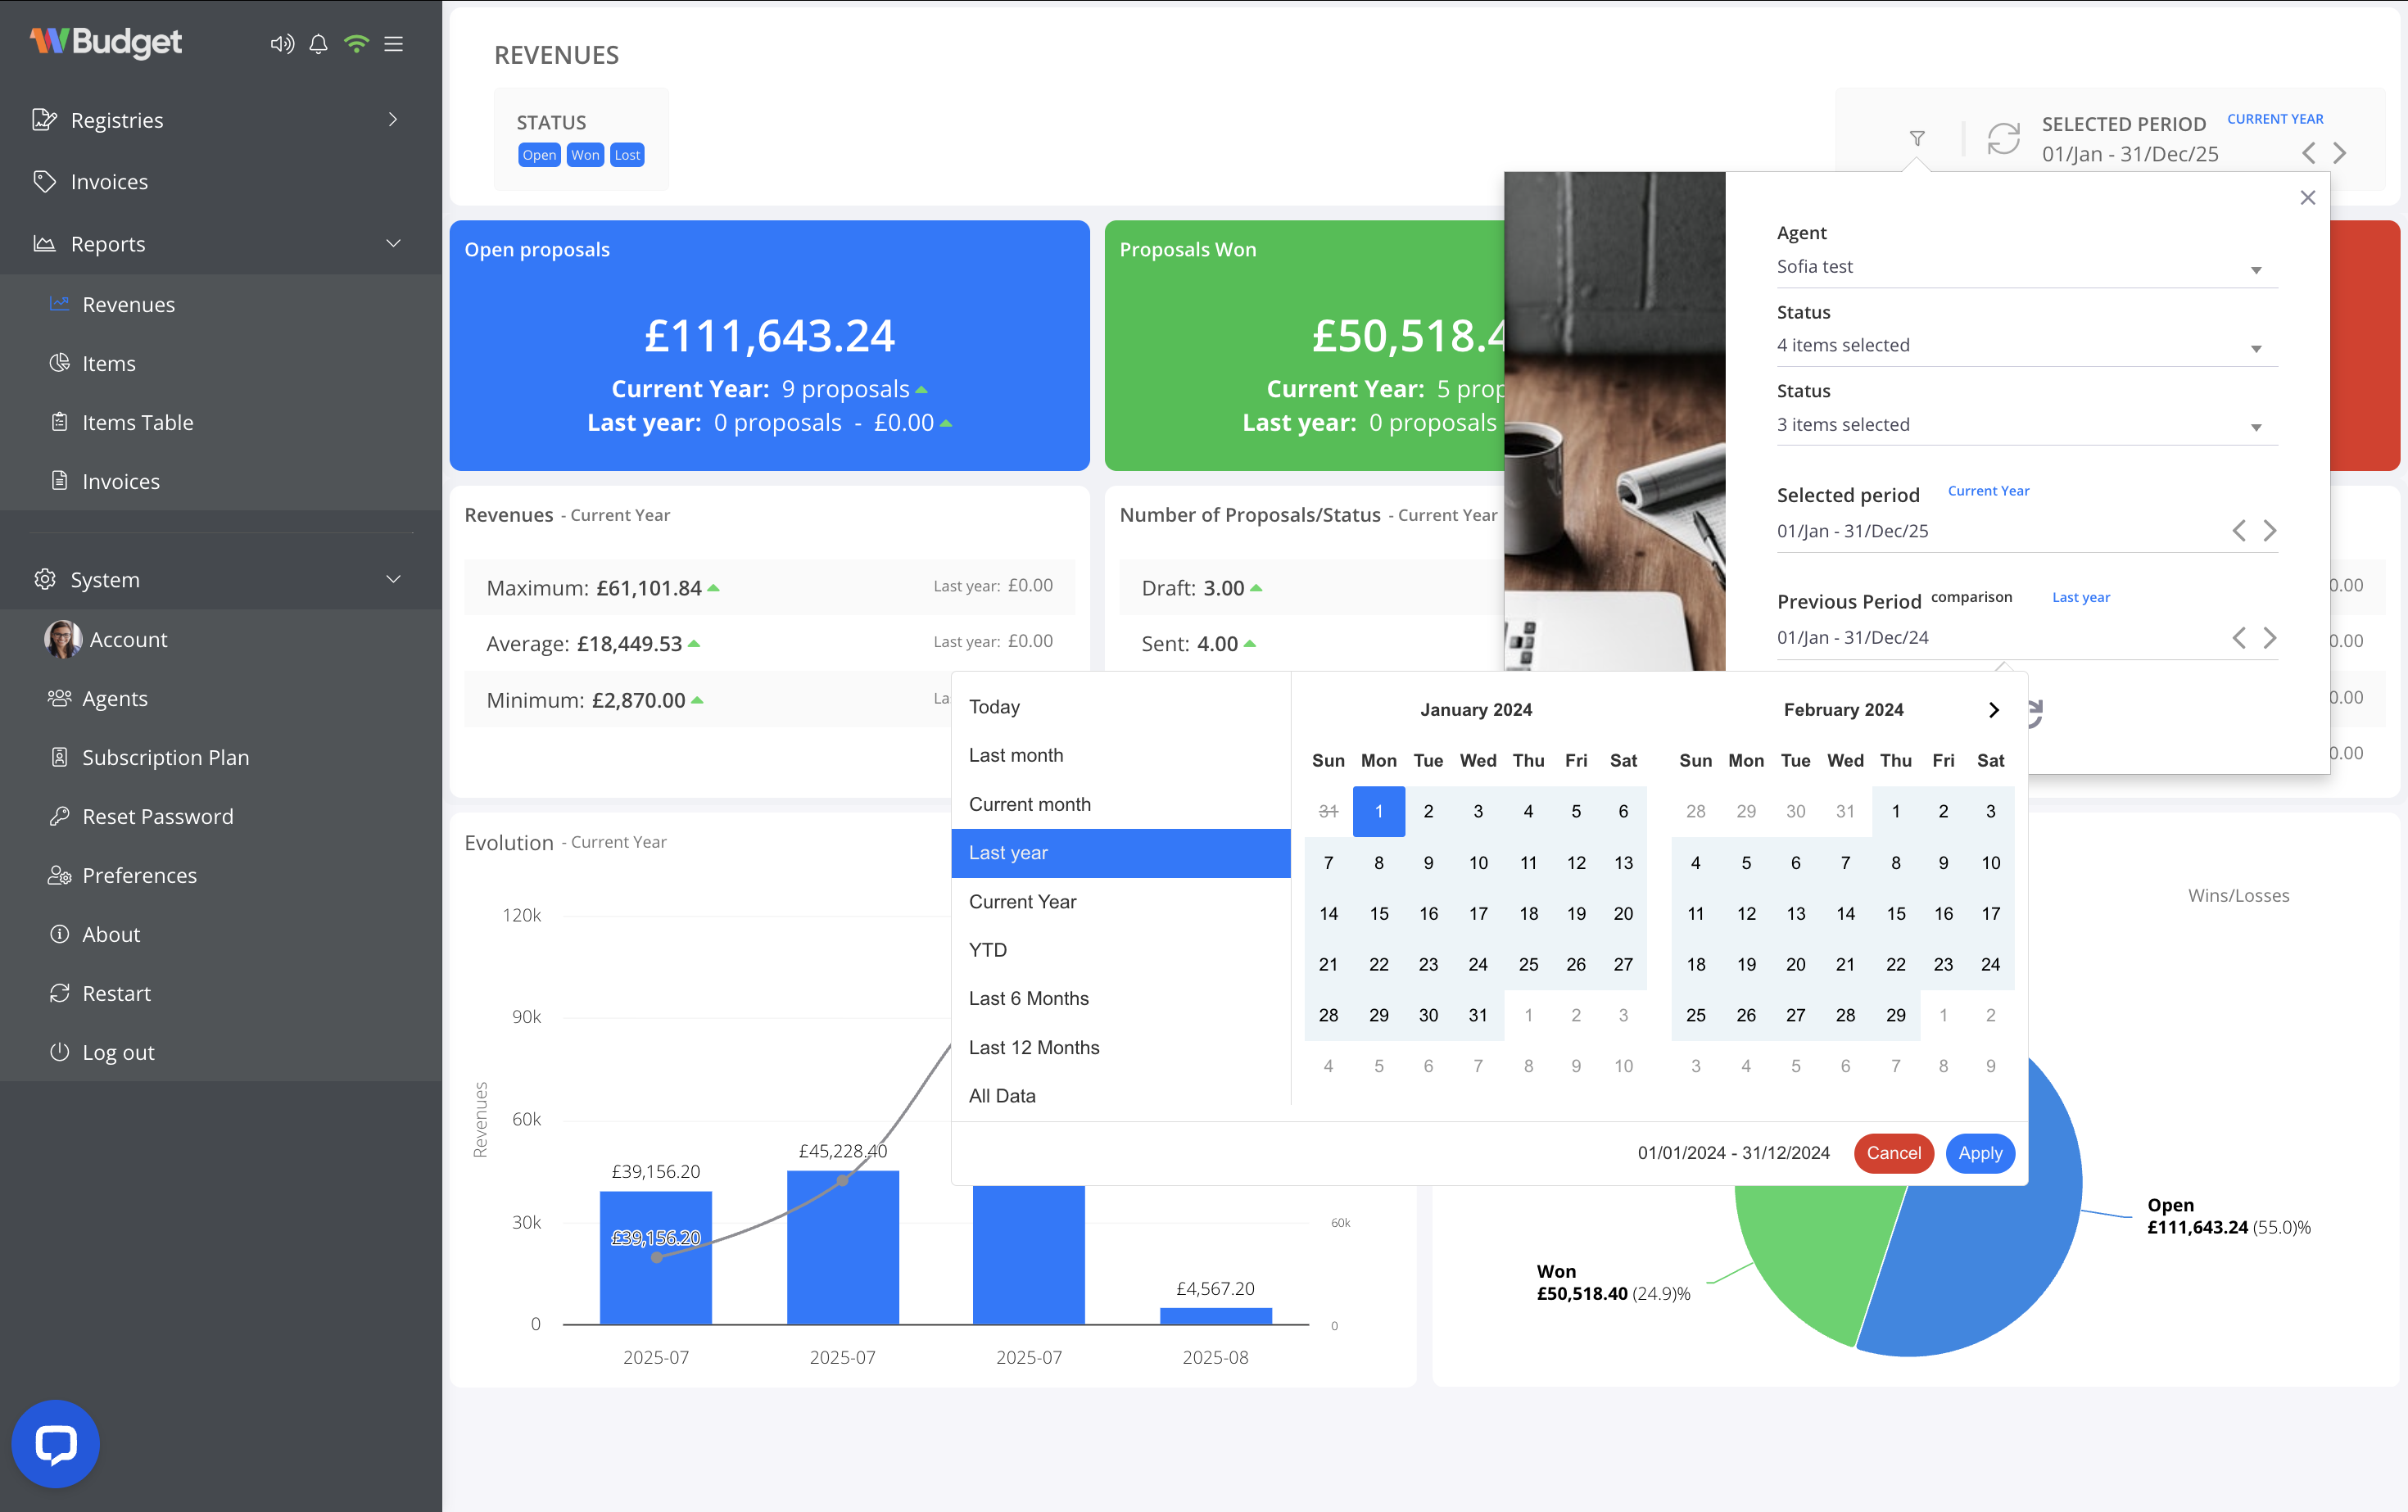
Available Filters
You can filter the report using the following criteria:
- Invoice status (Open, Paid, Cancelled)
- Responsible agent
- Selected period
- Today
- Current month
- Last month
- Current year
- Last year
- Last 6 or 12 months
- Custom date range
- Comparison period (e.g. current year vs last year)
How filters work
- Filters apply instantly to all charts and metrics.
- The selected period and comparison range are always visible at the top of the report.
- All values update dynamically to reflect the chosen criteria.
Practical Use Cases
The Revenues report is especially useful for:
- Monitoring overall financial performance
- Analysing invoice conversion and payment trends
- Supporting accounting and management reviews
- Comparing current results with historical periods
The Revenues report gives you a clear and actionable overview of your invoicing performance, ensuring full visibility into how your business is generating revenue.