Items Report
The Items report provides a detailed analysis of invoice revenue and quantities by item, helping you understand which products or services contribute most to your business results.
This report is especially useful for identifying top-performing items, monitoring trends, and supporting pricing or catalogue decisions.
General Overview
The Items report is structured into visual and analytical sections that work together.
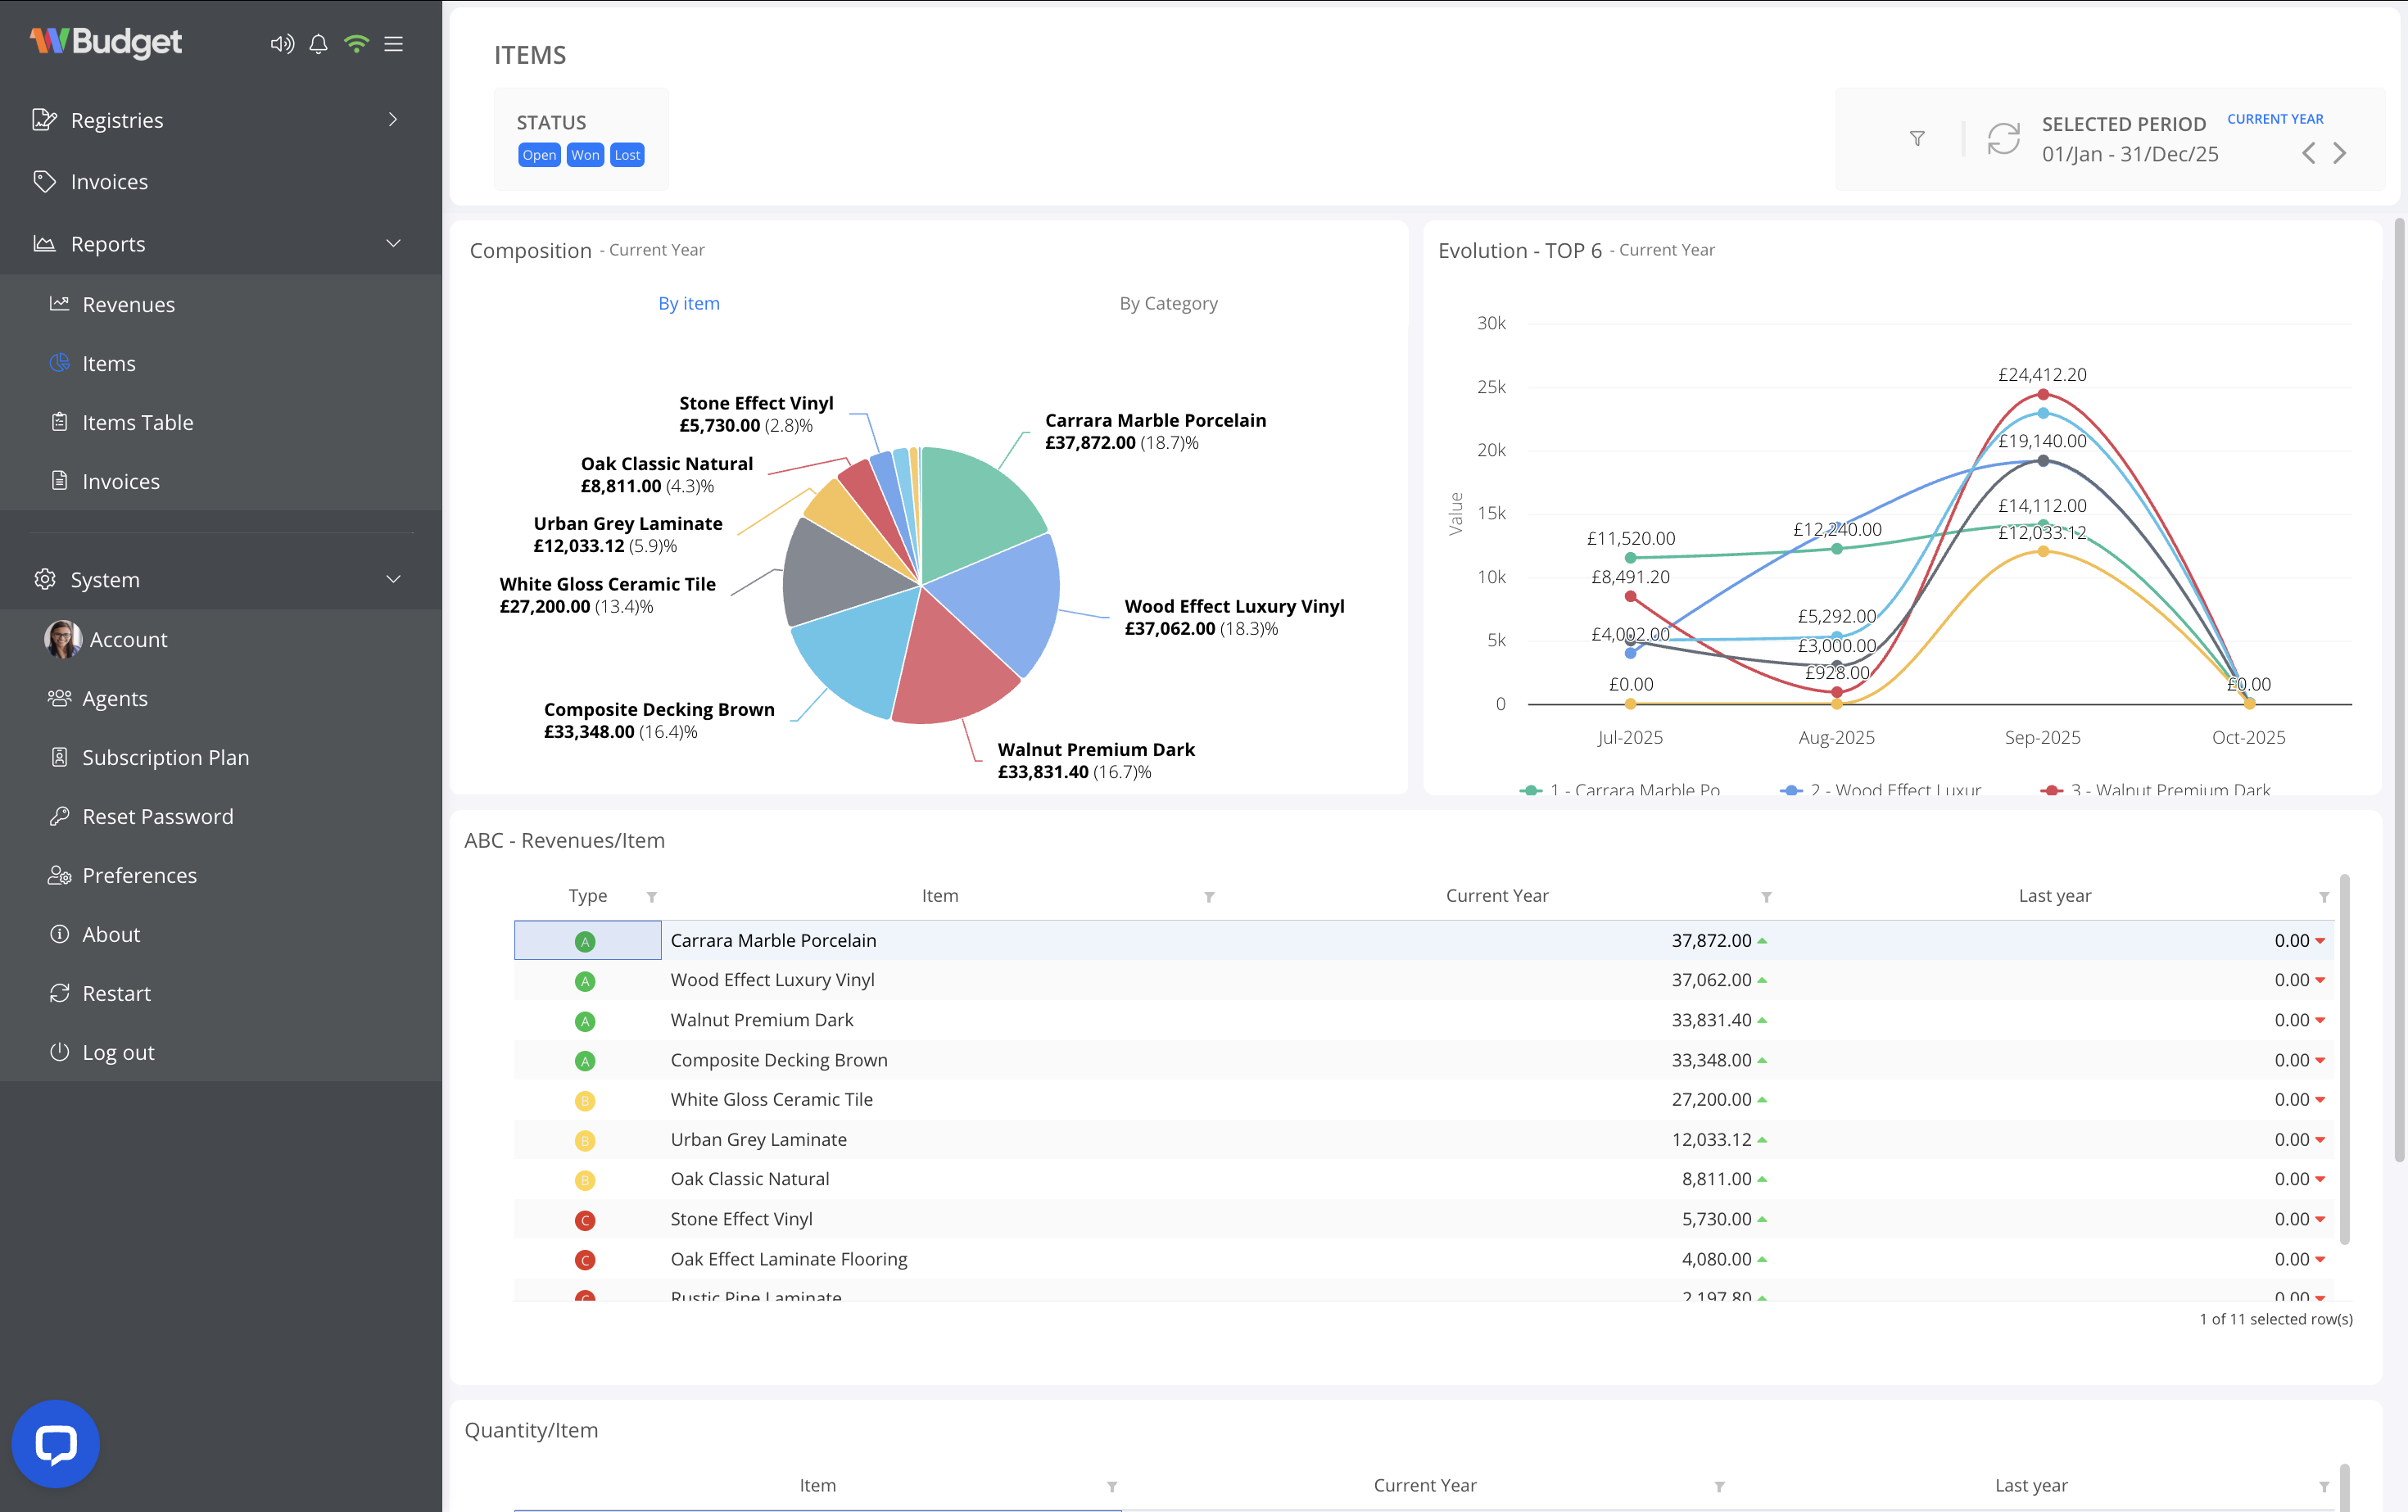
Revenue Composition by Item
A pie chart displays the revenue distribution by item for the selected period.
This allows you to quickly identify:
- Best-selling items
- Items with the highest revenue impact
- Revenue concentration across your catalogue
You can switch between:
- By item
- By category
depending on the level of detail required.
Revenue Evolution – Top Items
A line chart shows the revenue evolution of the top items over time.
This view helps you:
- Track performance trends
- Identify seasonal behaviour
- Compare revenue growth between key items
Only the top-performing items are displayed to keep the analysis clear and focused.
ABC Analysis – Revenue by Item
The ABC table classifies items according to their contribution to total revenue:
- A items – highest revenue contribution
- B items – moderate contribution
- C items – lower contribution
For each item, the table displays:
- Item name
- Revenue for the current year
- Comparison with the previous year
This classification supports inventory planning and strategic focus.
Quantity by Item
Below the revenue analysis, the report also includes quantity-based metrics, allowing you to:
- Compare sales volume independently from revenue
- Identify high-volume, low-margin items
- Detect underperforming items despite high prices
Filtering and Period Selection
All data in the Items report can be refined using filters:
- Invoice status (Open, Paid, Cancelled)
- Selected period
- Current year
- Last year
- Last 6 or 12 months
- Custom date range
- Comparison period for year-over-year analysis
Filters apply instantly and update all charts and tables simultaneously.
Practical Use Cases
The Items report is ideal for:
- Identifying best-selling products or services
- Reviewing catalogue performance
- Supporting pricing and commercial strategy
- Analysing revenue concentration and diversification
The Items report gives you clear visibility into how each item contributes to your invoicing results, enabling more informed and strategic business decisions.